live_coding_synth · P5LiveSketch
P5Live sin/cos Spirograph Sketch
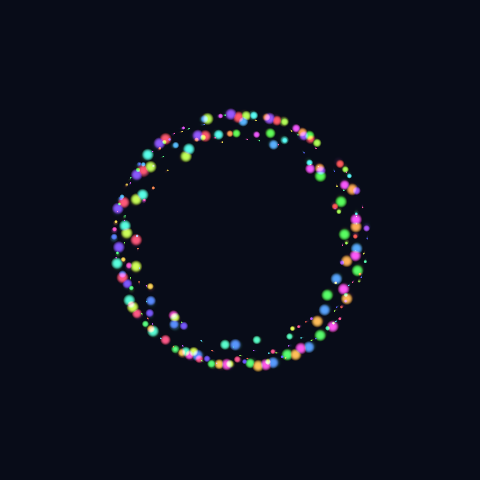
A pure-numpy port of the canonical p5.js sin/cos live-coding sketch: a spirograph-like cloud of points whose polar coordinates are themselves nested sin/cos chains. Three rings morph over time, each ring's instantaneous radius is a sin(t*omega_k + phi_k) added to a base radius, and every point is drawn as a soft disc whose hue is HSV((i + t*speed) / N, 0.65, 1.0). The whole canvas trails with persistence 0.93 per step so past frames leave a soft ghost — the same look you get in P5Live when you call `background(8, 12, 24, 30)` instead of `background(0)` each frame. Re-creates the live-coding session that Ted Davis (P5Live) and the Coding Train demonstrate in their 'sin/cos for generative art' lessons — exactly the kind of sketch a beginner writes on stage while narrating 'now I'm going to change that 0.13 to 0.21'.
Original: https://p5js.org
▶ Try the live demo (JS port) ▶ Run reference.py via Pyodide 10 formulas have instant JS ports. The Pyodide path runs the actual Python in your browser — first load is ~6 MB, then instant.
Math essence
For each point i in [0, N): a_i = i*point_freq + t*0.01; ring_mod = (1/R) Σ ring_radii[k] * sin(t*ring_freqs[k] + ring_phases[k] + jitter*0.5); r0 = 0.55*max_r + ring_mod; x = cx + r0*cos(a_i); y = cy + r0*sin(a_i); sz = 4 + 4*sin(t*size_freq + i*0.21); hue = (i/N + t*hue_speed/360) mod 1; canvas = max(canvas, falloff*HSV2RGB(hue, 0.65, 1.0)).
Parameters
| Name | Type | Default | Range | Description |
|---|---|---|---|---|
dim | int | 480 | 256–720 | Output side length in pixels (HxW). |
n_points | int | 240 | 40–800 | Number of sin/cos-driven points per frame. |
n_rings | int | 3 | 1–6 | Number of nested sin/cos rings (radius-morph chains). |
ring_radii | tuple | 0.36,0.2,0.1 | — | Per-ring amplitude as fraction of max radius. |
ring_freqs | tuple | 0.07,0.13,0.21 | — | Per-ring sin time-frequency. |
ring_phases | tuple | 0,1.7,3.4 | — | Per-ring sin phase offset. |
point_freq | float | 0.31 | 0.05–1.5 | Angular step per point (radians). |
size_freq | float | 0.13 | 0.02–0.5 | Time-frequency of the per-point size oscillation. |
hue_speed | float | 30 | 0–120 | How fast the per-point hue cycles (degrees per tick). |
trail | float | 0.93 | 0–0.99 | Per-step canvas persistence. |
bg_color | tuple | 8,12,24 | — | Background colour. |
seed | int | null | 0–999999 | RNG seed (controls the per-point jitter). |
Reference
First 60 lines of reference.py. Full source:
library_external/live_coding_synth/P5LiveSketch/reference.py
"""P5LiveSketch — a p5.js-style live-coding sketch in pure numpy.

A sin/cos-driven parametric animation that re-creates the visual
a P5Live session produces when a coder types lines like:

    function setup() { createCanvas(W, W); }
    function draw() {
        background(8, 12, 24);
        translate(W/2, W/2);
        for (let i = 0; i < 200; i++) {
            const r = 80 + 60 * sin(t * 0.07 + i * 0.13);
            const a = i * 0.31 + t * 0.01;
            const x = r * cos(a);
            const y = r * sin(a);
            const sz = 6 + 4 * cos(t * 0.13 + i * 0.2);
            fill(200 + 50*sin(t + i), 100 + 100*cos(t*0.5), 200);
            noStroke();
            ellipse(x, y, sz, sz);
        }
    }

In numpy form: a single `step()` advances the clock, every frame
rebuilds a vectorised cloud of 200 sin/cos-driven ellipses on a
trail-decaying canvas — the canonical "p5.js sin/cos generative
art" sketch that the live-coding community has run for a decade.
The default sketch is a *hypotrochoid-style spirograph* of 3
nested sin/cos rings whose radii morph over time, exactly the
"circle of circles" pattern that appears in the Coding Train's
"sin/cos" lessons and in P5Live demo reels.
"""

from __future__ import annotations

from typing import ClassVar

import numpy as np


class P5LiveSketch:
    """A p5.js-style sin/cos generative sketch rendered in numpy.

    The default sketch draws a spirograph-like cloud of points
    whose polar coordinates are themselves nested sin/cos chains:

        ring_k(θ_i) = R_k + r_k * sin(t * ω_k + φ_k)
        a(θ_i)     = θ_i * n + t * 0.01
        x = Σ ring_k * cos(a + δ_k)
        y = Σ ring_k * sin(a + δ_k)
        sz = 4 + 4 * sin(t * 0.13 + i * 0.21)
        hue = HSV( (i + t * 30) / N, 0.6, 1.0 )

    The full canvas is redrawn every step on a low-trail background
    so past frames leave a soft ghost — the same trail-accumulation
    look that P5Live / p5.js sketches produce when you `background(0, 5)`
    instead of `background(0)` each frame.
    """

    family: ClassVar[str] = "live_coding_synth"
    sketch: ClassVar[str] = "P5LiveSketch"
Try running it locally
The reference implementation is self-contained Python with numpy. Install the package and run:
python library_external/live_coding_synth/P5LiveSketch/reference.pyNeed help? See Learn for the standard environment setup, or Playground for an in-browser sketchbook.
More from live_coding_synth
Hydra Video Synth (numpy port of Olivia Jack's Hydra)
live_coding_synth · HydraVisualSynth
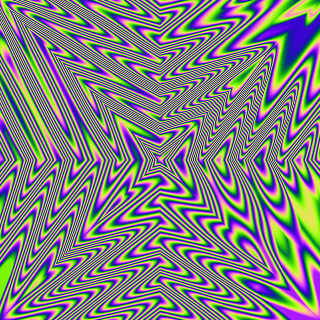
A pure-numpy port of the core Hydra video-synth API: chains of sources (osc, noise, shape, gradient, solid, voronoi) composed with geometry modifiers (rotate, scale, scroll, kaleid, pixelate, repeat) and color/blend modifiers (invert, posterize, thresh, color, brightness, contrast, luma, saturate, hue, add, diff, mult, blend) — including the signature modulate operator a.modulate(b, scale), which uses b's red and green channels to displace a's x and y coordinates (with modulateRotate, modulateScale, modulatePixelate, modulateKaleid variants).
Strudel 16-Step Pattern Visualiser (4x4 grid of sample-typed shapes)
live_coding_synth · StrudelVisualizer
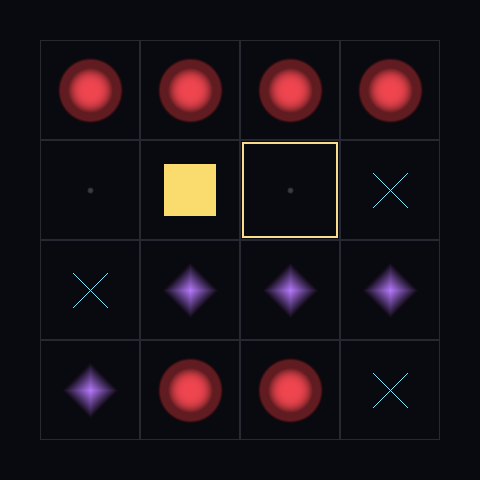
A pure-numpy port of Strudel's signature 4×4 (16-step) pattern grid.
TidalCycles Mini-Notation Pattern Visualiser
live_coding_synth · TidalCyclesPattern
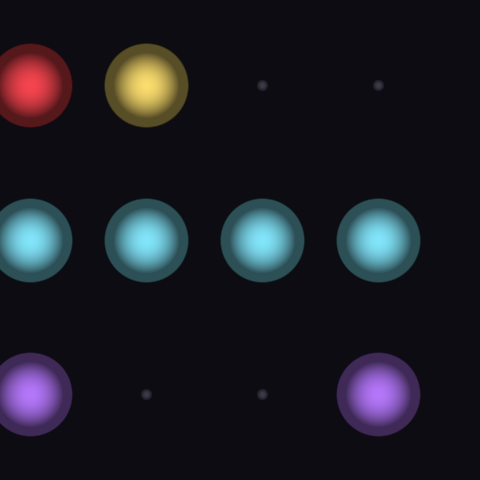
A pure-numpy port of TidalCycles' rhythm mini-notation, expanded per cycle into a row of (sample, variant) tuples and visualised as a row of pulsing shapes that scroll horizontally.
Topolectures (Olivia Jack) — 2D cell grid + text snippets + audio-amplitude pulse
live_coding_synth · TopolecturesOliviaJack
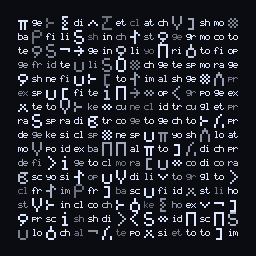
A pure-numpy port of Olivia Jack's Topolectures: a 2D grid of cells, each cell holding a 1–2 character text snippet from a topology-mathematics corpus (sheaf, locale, frame, open, closed, cover, limit, point, net, filter, basis, ideal, prime, ring, mod, field, topos, yoneda, etale, sieve, …) and brightness pulsed by a synthetic audio-amplitude signal.