generative_pioneers · hebert_plotter_trajectory
Plotter Trajectories (Hébert)
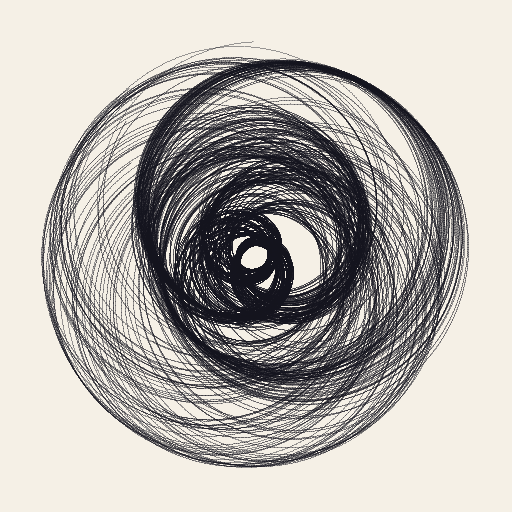
Jean-Pierre Hébert's plotter-trajectory idiom — parametric Lissajous-like curves drawn over multiple passes, each pass slightly phase-shifted, each segment modulated by the local velocity of the pen so that slow regions lay down heavier pigment and fast regions trace a ghost line. Hébert's practice (begun on an HP 9830 in 1974, first plotter in 1978) is the inverse of screen-rendering: the algorithm is a 'score' that the plotter executes in a single unbroken movement, and the ink flow — variable, semi-physical — is part of the piece. The visual result is a dense calligraphic vortex that sits between gesture and computation.
Original: https://digitalartmuseum.org/hebert/practice.html
▶ Try the live demo (JS port) ▶ Run reference.py via Pyodide 10 formulas have instant JS ports. The Pyodide path runs the actual Python in your browser — first load is ~6 MB, then instant.
Math essence
Each curve is x(t) = cx + r(t)·cos(2π·b·t)·cos(2π·a·t + δ) − r(t)·sin(2π·b·t)·sin(2π·a·t + δ)·½ (and y symmetric), with r(t) a slow radial modulation. Local pixel alpha ∝ 1 / (1 + speed / v_ref), so the line darkens where the pen slows.
Parameters
| Name | Type | Default | Range | Description |
|---|---|---|---|---|
dim | int | 512 | 200–1200 | Square canvas side length |
n_passes | int | 3 | 1–8 | Passes over the same area (each phase-shifted) |
n_curves | int | 18 | 1–80 | Curves drawn per pass |
length | float | 12000 | 1000–60000 | Polyline samples per curve |
a | float | 3 | 1–12 | Lissajous-x frequency |
b | float | 4 | 1–12 | Lissajous-y frequency |
delta | float | 1.5707963 | 0–6.28318 | Phase offset (radians) |
d_phase_per_pass | float | 0.05 | -0.5–0.5 | Phase increment per pass |
velocity_amp | float | 0.45 | 0–1 | How much velocity modulates alpha |
thickness | float | 1 | 0.5–3 | Ink line thickness |
bg_color | tuple | 245,240,230 | null–null | Paper RGB |
ink_color | tuple | 20,20,30 | null–null | Ink RGB |
seed | int | null | 0–999999 | RNG seed |
Reference
First 60 lines of reference.py. Full source:
library_external/generative_pioneers/hebert_plotter_trajectory/reference.py
from __future__ import annotations

from typing import ClassVar

import imageio.v2 as imageio
import numpy as np


class HebertPlotterTrajectory:
    family: ClassVar[str] = "generative_pioneers"
    sketch: ClassVar[str] = "hebert_plotter_trajectory"

    def __init__(
        self,
        dim: int = 512,
        n_passes: int = 3,
        n_curves: int = 18,
        length: float = 12000.0,
        a: float = 3.0,
        b: float = 4.0,
        delta: float = 1.5707963,
        d_phase_per_pass: float = 0.05,
        velocity_amp: float = 0.45,
        thickness: float = 1.0,
        bg_color: tuple[int, int, int] = (245, 240, 230),
        ink_color: tuple[int, int, int] = (20, 20, 30),
        seed: int | None = None,
    ) -> None:
        self.dim = dim
        self.n_passes = n_passes
        self.n_curves = n_curves
        self.length = length
        self.a = a
        self.b = b
        self.delta = delta
        self.d_phase_per_pass = d_phase_per_pass
        self.velocity_amp = velocity_amp
        self.thickness = thickness
        self.bg_color = np.array(bg_color, dtype=np.uint8)
        self.ink_color = np.array(ink_color, dtype=np.uint8)
        self._seed = seed
        self.rng = np.random.default_rng(seed)
        self.canvas = np.full((dim, dim, 3), self.bg_color, dtype=np.uint8)
        self.time = 0
        self._dirty = True

    def reset(self, seed: int | None = None) -> None:
        if seed is not None:
            self._seed = seed
        self.rng = np.random.default_rng(self._seed)
        self.canvas = np.full((self.dim, self.dim, 3), self.bg_color, dtype=np.uint8)
        self.time = 0
        self._dirty = True

    def _plot_one_curve(
        self,
        a: float,
        b: float,
        delta: float,
        length: float,
Try running it locally
The reference implementation is self-contained Python with numpy. Install the package and run:
python library_external/generative_pioneers/hebert_plotter_trajectory/reference.pyNeed help? See Learn for the standard environment setup, or Playground for an in-browser sketchbook.
More from generative pioneers
Interruptions (Molnár)
generative_pioneers · molnar_interruptions
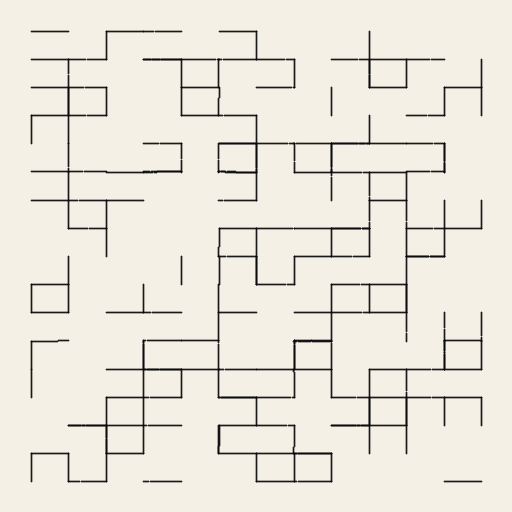
Vera Molnár's 1968 'Interruptions' series: a regular grid of rectangle cells where each cell's four border edges are drawn independently, each with its own random probability of being omitted.
Line Arrangements (Mohr)
generative_pioneers · mohr_line_arrangement
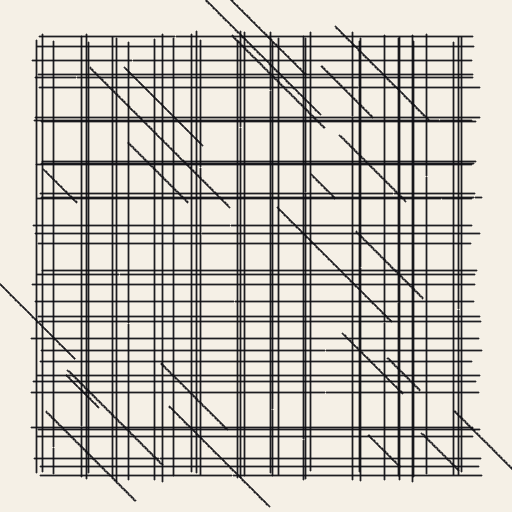
Manfred Mohr's 1969 plotter 'Line Arrangements': a fixed grid of columns and rows, each carrying a small set of nearly-parallel lines whose exact positions are random within the cell, overlaid with a layer of 45° diagonals whose length, position and orientation are independently random.
Paint by Numbers (Haeberli)
generative_pioneers · haeberli_painterly
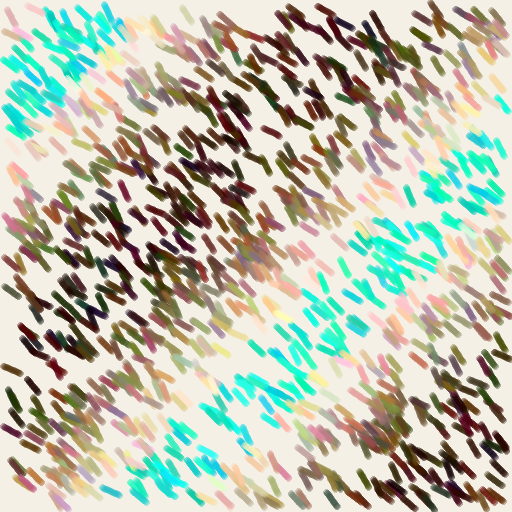
Paul Haeberli's 1990 SIGGRAPH 'Paint by Numbers' — the founding paper of stroke-based rendering.
Walk-through-Raster (Nake)
generative_pioneers · nake_walk_sequence
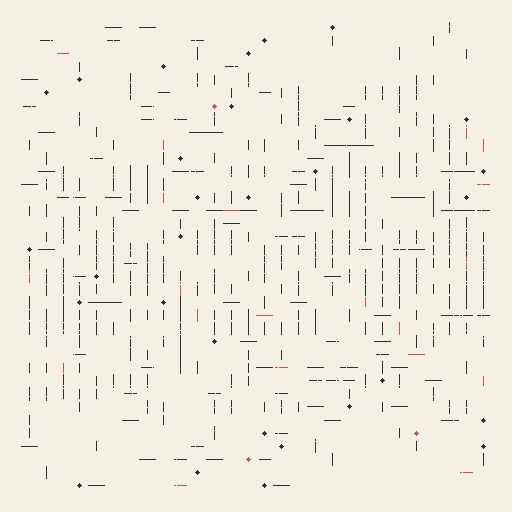
Frieder Nake's 1966 'Walk-through-Raster' program (Algol 60 on a Telefunken TR4, plotted on a ZUSE Graphomat Z64): a repertoire of six signs — empty, vshort, vlong, hshort, hlong, dot — is sampled into a Markov chain whose transition probabilities vary with chain position so that 'vertical strokes are high at the chain's middle, empties dominate at the ends'.